Visualising crystal structures with fresnel and matplotlib
This example takes some crystal structures and visualises them with fresnel and matplotlib. It requires fresnel to be installed from conda-forge with conda install fresnel -c conda-forge.
[1]:
from matador.utils.viz_utils import fresnel_plot
from matador.utils.optimade_utils import optimade2dict
import requests
[2]:
crystals = [
    optimade2dict(structure) for structure in
    requests.get("https://optimade.materialsproject.org/v1/structures?page_limit=6").json()["data"]
]
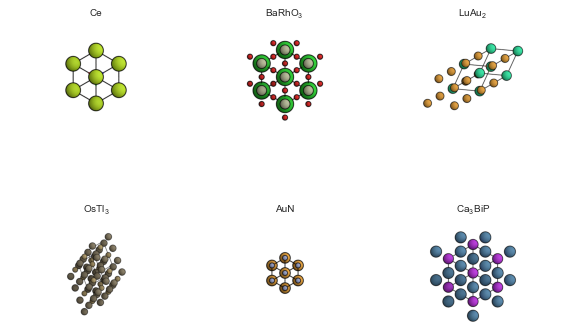
[3]:
import matplotlib.pyplot as plt
fig, axes, scenes = fresnel_plot(crystals, fig_rows=2, figsize=(8, 8))
plt.tight_layout()
Rendering scenes: 6it [00:21, 3.64s/it]
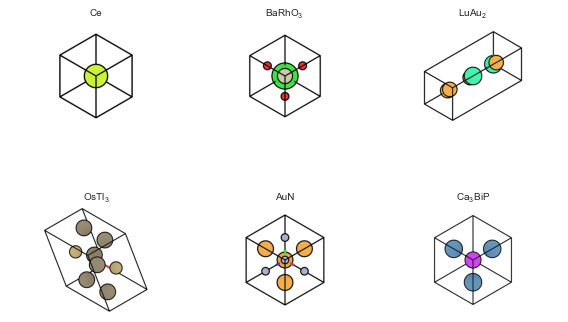
[7]:
import fresnel
from functools import partial

fig, axes, scenes = fresnel_plot(
    crystals,
    renderer=partial(fresnel.pathtrace, w=400, h=400, light_samples=64, samples=64),
    figsize=(8, 8),
    fig_rows=2,
    extension=6*[(2, 2, 2)],
    lights=fresnel.light.rembrandt,
    standardize=False,
)
Rendering scenes: 6it [00:34, 5.71s/it]
Optional: install PySide2 to use interactive scene views with fresnel. Useful for finding the desired camera angle for a given structure.
[8]:
from PySide2 import QtCore
%gui qt
import fresnel.interact
view = fresnel.interact.SceneView(scenes[5])
view.show()
breakpoint()
[9]:
# Move camera to desired position and observe changes
repr(scenes[5].camera)
[9]:
'fresnel.camera.Orthographic(position=(10.249999, 10.249999, 10.249999), look_at=(4.365, 4.365, 4.365), up=(-0.4082483, 0.8164966, -0.4082483), height=18.346677780151367)'
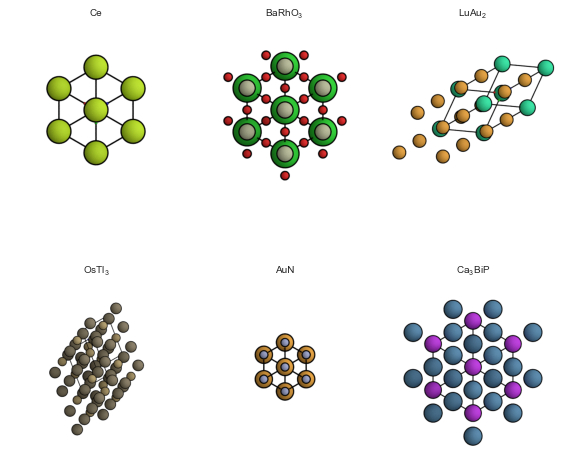
[10]:
from matador.utils.viz_utils import rerender_scenes_to_axes
rerender_scenes_to_axes(scenes, axes)
Rendering scenes: 6it [00:15, 2.50s/it]
[11]:
fig
[11]: