Projected bandstructures/DOS as subplots with custom colours
This example notebook provides a recipe/hack to get projectors as subplots. This functionality is not wrapped into the dispersion script (as of Aug 2020) as the whole module needs refactoring first. These examples assume some spectral files with the seedname “Si” in the current directory.
[1]:
from matador.plotting.spectral_plotting import dispersion_plot, dos_plot
import matplotlib.pyplot as plt
%matplotlib inline
[4]:
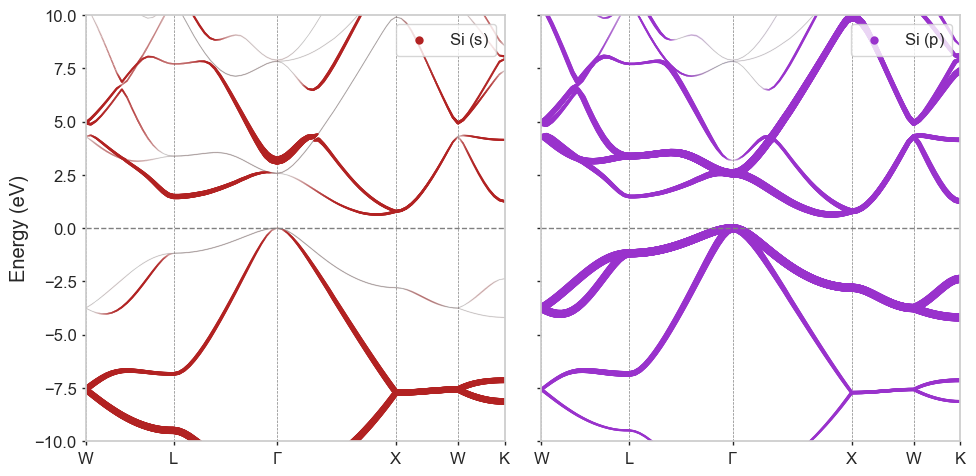
fig, axes = plt.subplots(1, 2, figsize=(10, 5), sharey=True)
colours_override = ["firebrick", "darkorchid"]

for ind, proj in enumerate([[("Si", "s", None)], [("Si", "p", None)]]):
    dispersion_kwargs = {
        "projectors_to_plot": proj,
        "plot_pdis": True,
        "pdis_interpolation_factor": 10,
        "colours": [colours_override[ind]],
        "colour_cycle": [colours_override[ind]]
    }
    dispersion_plot(
        "Si",
        axes[ind],
        dispersion_kwargs
    )

axes[1].set_ylabel(None)
plt.tight_layout()
Detected path labels from cell file
Detected path labels from cell file
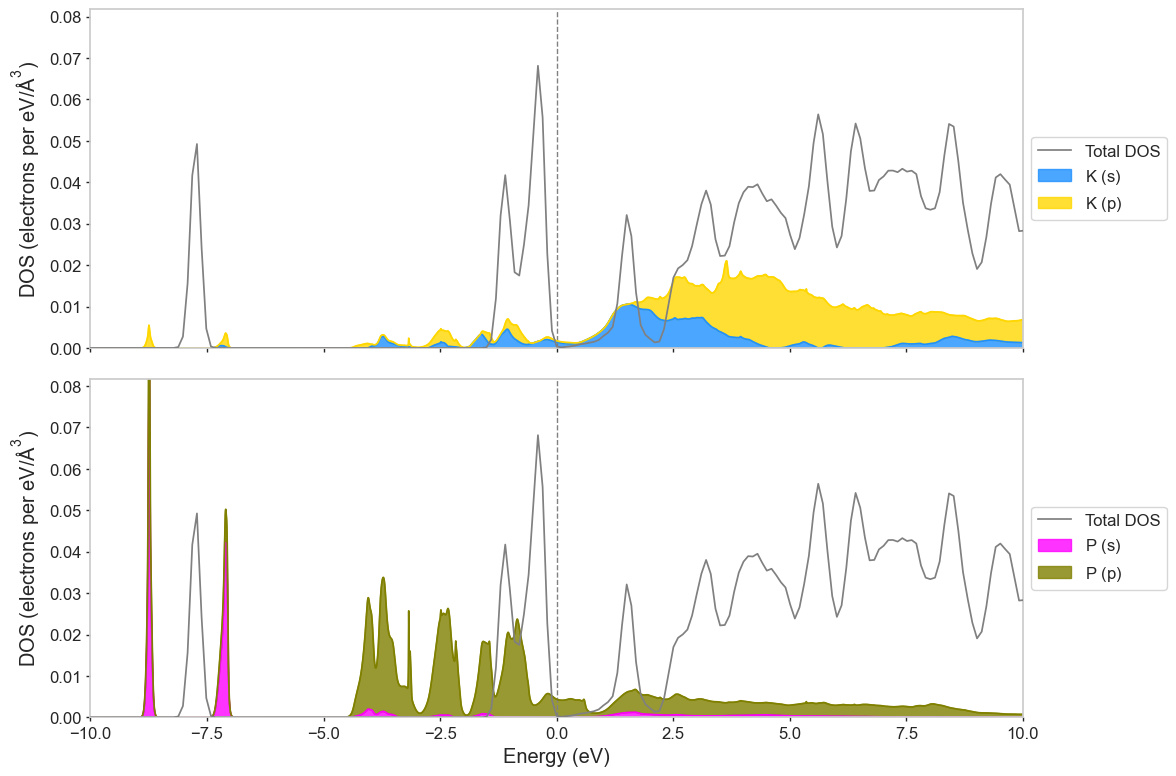
We can also do the same with density of states plots. Note here, the PDOS is from a different structure and calculation to the total DOS, and is shown only for ilustrative purposes.
[5]:
fig, axes = plt.subplots(2, 1, figsize=(12, 8), sharex=True)
colours_override = ["dodgerblue", "gold", "magenta", "olive"]
for ind, proj in enumerate([[("K", "s", None), ("K", "p", None)], [("P", "s", None), ("P", "p", None)]]):
    dos_kwargs = {
        "projectors_to_plot": proj,
        "colours": colours_override[2*ind:],
        "pdos_hide_sum": True,
        "plot_pdos": True
    }
    dos_plot("Si", axes[ind], dos_kwargs)
axes[0].set_xlabel(None)
plt.tight_layout()